What is Gantt chart?
A Gant chart is a horizontal bar chart which gives you a graphical representation of your schedule that helps you to plan, coordinate and track the particular tasks of your project.
The Gantt chart is named so because it was invented by Henry Gantt in the year 1910.
Advantages of using Gantt chart
There are several reasons why Gantt charts are so popular among project managers today for the following reasons:
-
Organized
Having a visual lead to a better organization as well as a better handle on the project.
-
Project tracking
Using Gantt chart you can easily track and visualize each and every step of your project with all the tasks that are assigned to your team members. When everyone can see how their part affects all other parts, the chances of slacking is much lower.
-
Color bars
Gantt charts often use a variety of colors to help visualize and organize particular tasks which make project managers to easily coordinate and meet with everyone involved in the project process.
-
Assign task
Using Gantt charts, you no longer have to map out your project timeline on paper and Gantt chart has the ability to automatically create based on our imputes.
The best thing about Gantt chart is that when using a Gantt chart and its technology, it’s easier to recalculate project timelines easily.
-
Define tasks on a realistic schedule
Gantt chart allows you to visualize your key information about your project and allows you:
- Set your tasks that are to be performed
- Set the start and end date for each of your tasks
- Enables you to foresee each of your tasks
- Superposition your certain tasks and overlay the durations
There are 3 ways to make sure that you are using a Gantt chart effectively.
-
Keep track of your progress
Having up-to-date progress bar for all your tasks on the Gantt chart will help you quickly see that if you are going to be on schedule and if not what other tasks are going to be affected.
-
Define a Critical path
Using Gantt chart, you can easily look out all your activities and take into account timing and dependent relationships for each of your tasks, which enables you to calculate the longest path of your project right from start to finish.
This will basically show you your project critical tasks versus tasks that can be delayed without risking and thus making your project late.
Once you calculate your critical path highlight the tasks on it or use Tiemchart project management software to do it for you.
-
You can add milestone markers
You can choose symbols to represent your milestones that are major events that either has a large part in the processor must be completed before progress can continue.
Place them on the Gantt chart beneath the date or time when they occurred. This makes you very flexible because by just looking at your Gantt chart when big importance deadlines actually are.
How to create a Gantt chart in Excel
-
Make your task table
In order to create a Gant chart, you have to list each of your project tasks in order of start date like from beginning date to the end date and include your task name, start date, duration of the project and an end date.
For example, let’s take the below data to create a Gantt chart.

NOTE: You should make your data complete as using MS Excel you have some limitation in adding some steps or extending out which might make you reformat all of your Gantt charts form the beginning.
-
Build a Bar chart
Open your Microsoft Excel and;
- Select Insert
- Click on Bar chart
When the drop menu will appear you have to choose the flatly stacked bar chart that is highlighted in green below. Choosing this option will insert a blank bar chart on your Excel spreadsheet.

Now, add your start date data.
- Right-click on the blank chart and click on select data.
- Under Legend Entries (Series) Click.

- Click on the black space under the series name and from your data select the start date.


- Now click on the select icon at the end of the series value and select all your start dates.


- After selecting the start dates, click on the select icon at the end.

Then add your duration:
- Under Legend entries, click on Add.
- Click on the blank space under the series name and from your data, select duration.

 Now click on the select icon at the end of the series value and select all your start dates.


- After selecting the start dates, click on the select icon at the end.

Now, change the dates on the numbers on the left side of the chart with your task lists.
- Under Horizontal (Category) Axis Labels, click on
- Select all the lists of your task.


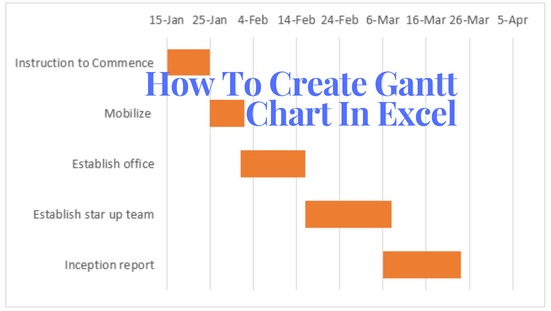
- Click OK and your Gantt chart will be similar to below.
 4. Formatting Your Gantt Chart
The Gantt chart you have created is just a stacked bar chart and the blue bars are your start dates and the orange are the duration of your project.
Delete the start date and the duration legend on the right of your Gantt chart. This will make more space in your Gantt chart.
When you give a closer look into to your Gantt chart, you will notice that the tasks are in the reverse format. So, in order to correct it.
- Click on the list of tasks on your Gantt chart to select your tasks lists.
- Now, Right-click on the list and
- Select Format Axis
- Under Axis position, mark the checkbox, categories in reverse order, and
- Click on Close.
So, in order to hide the blue bars or your tasks and get space in your Gantt chart, you have to:
- Click on any of the blue bars, this will select all the blue bars.
- Click on Fill and select No fill then,
- Click on Border color and select No line.
Now, in order to remove the blank white spaces at the start of your Gant chart;
- Click on the Start date in your data table and right click on it.
- Select Format Cells and then
- Select General

- In your Gantt chart, move over your cursor and right click over the Dates above the orange bars and select Format Axis.
- Change the number in Minimum bound that you have noted i.e 43115 or whatever you have noted.
- Select Close.
You can either make changes in the Major unit to any numbers and see which works that makes your Gantt chart look better.
You can edit more in order to make your Gantt chart look a bit better and remove the space between the orange bars.
- Right-click on the top orange bar and select Format Data Series.
- Under Series Options, set the Gap width percentage that makes your chart look better.

And finally you will get a good looking Gantt chart as below:

An Easier Way
So, you have come long across to prepare your Gantt chart using MS Excel and has to remember a lot of procedures in order to make a good looking perfect Gantt chart.
If you carry on preparing your Gantt chart using Microsoft Excel, you will have to do a lot of work, which will make your work harder and will not leave any left for you to concentrate on your work and this might affect on your project progress as well.
Disadvantages of creating Gantt chart on excel
- Excel lacks many basic features such as Gantt charts and task dependencies and it is actually not meant to be used as a project management tool.
- In order to account for the lack of task dependencies and your other activities in Excel, most of your complicated scripting is often needed or other third party components are needed to be installed.
- As Excel is desktop application software, it makes your project team members and stakeholders always ask for a latest up-to-date copy of your project schedule from the manager, which can create an extra work for the project managers.
- Also, as Excel is a desktop application, it is not in the level where in today’s internet technology where project management software is currently heading with more collaboration and transparency to all the team members, stakeholders or all those are involved in the project process.
How to Create a Gantt chart using TIEMCHART project management software

TIEMCHART inbuilt Gantt chart software tool helps you to carry out project planning at your fingertip. Dynamically place and modify task dates and set dependencies between tasks and visually interact with your tasks and directly monitor progress within the chart.
So, let’s get started.
- From the project dashboard, click on the project.
- Select your project and click on Gantt chart.
(You can also change your Gantt chart view in Days, Weeks, Months or year as per your need.)
-
- Mark the checkbox to show the Gantt chart view.
- Click on the plus (+) symbol to add a new task to your project
- Give the task code and the task name you desire.
- Change the task color, change your plan date, baseline date, and
- Click Save.
Tiemchart powered by Insiet ©
Are you project manager or business owner looking for a dashboard and reporting tool? Tiemchart is building customised reports and dashboard using the power of a BI Tools called Insiet © https://insiet.com/ . They are growing popularity around M&A and Intercompany:
Merger and Acquisition solution from Insiet © https://insiet.com/merger-acquisition-ma-system-integration/
Intercompany Reconciliation Solution from Insiet © https://insiet.com/solution/intercompany-reconciliation/