Forward Pass and Backward Pass in Project Scheduling
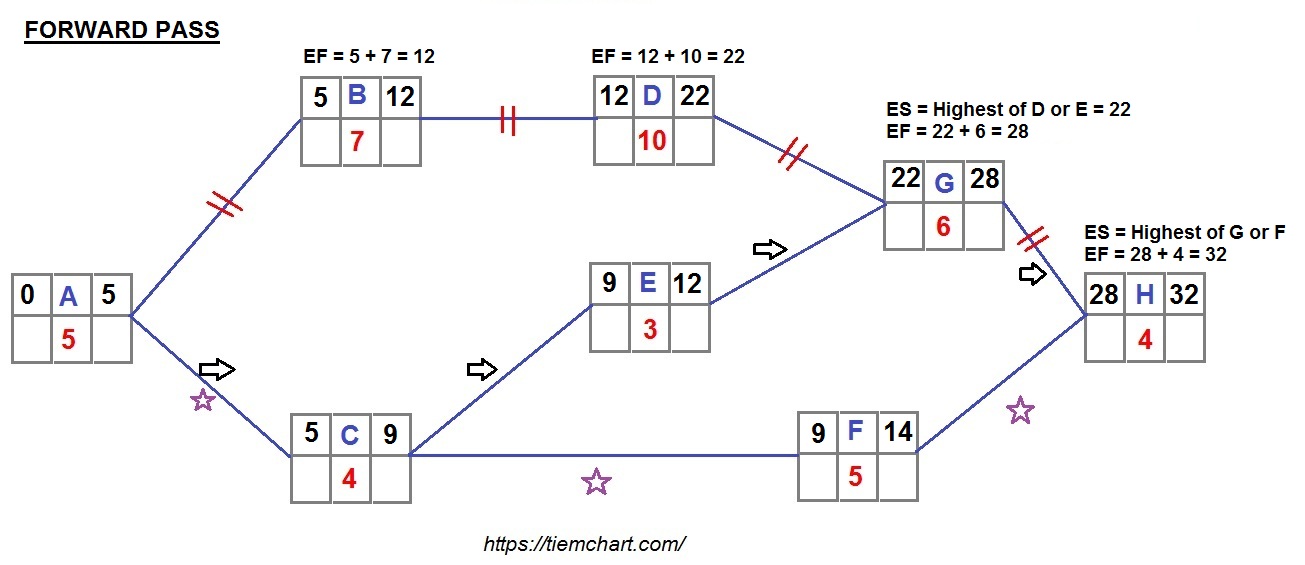
Forward pass is a technique to move forward through network diagram to determining project duration and finding the critical path or Free Float of the project.
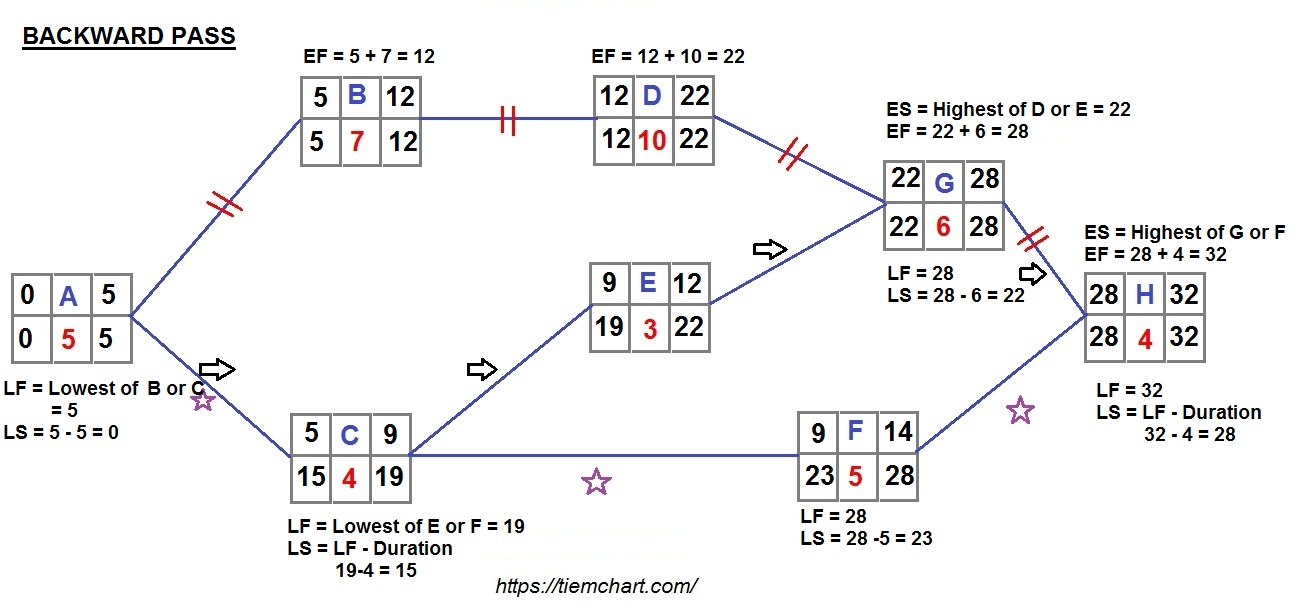
Whereas backward pass represents moving backward to the end result to calculate late start or to find if there is any slack in the activity.
Let us try and understand few terms that as a project manager you will encounter.
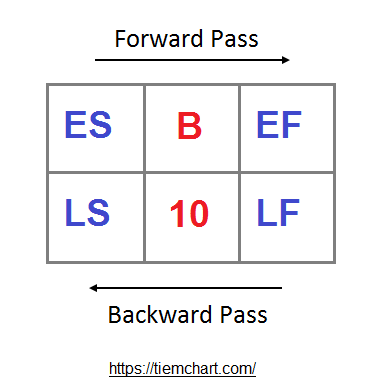
How to plot Early Start (ES), Early Finish (EF), Late Start (LS) and Late Finish (LF) in a network diagram?
Early Start (ES) is plotted on the 1st left corner box at the top. Likewise Early Finish (EF) is plotted on top right corner box.
Late Finish (LF) is on the right corner box at the bottom and Late Start (LS) is plotted on the left bottom corner box.
Activity name “B” is in the 2nd box duration represented by 10 is on the 5th box at the middle.

What is Early Start?
Early Start (ES) represents the earliest start of an activity considering the dependency preceding task. If an activity is having more than one dependency predecessor, then ES will be the highest Early Finish (EF) of the dependency task.
Early Start = Maximum (or Highest) EF value from immediate Predecessor(s)
How to apply Forward Pass to calculate Early Finish (EF)?
In order to calculate Early Finish, we use forward pass. Means moving from Early Start towards right to come up with Early Finish of the project.
Early Finish (EF) = ES + Duration
If Early Start is 6 days and duration is 10 days, EF = 6 + 10 = 16 Days
 What is Late Finish (LF)?
Late Start (LS) is the latest date that the activity can finish without causing a delay to the project completion date.
How to apply Backward Pass to calculate Late Start (LS)?
In order to calculate Late Start (LS), we apply backward Pass moving from Late Finish and deducting from activity duration.
LS = LF – Duration
If Late Finish is 30 days and duration is 10 days, LS = 30 – 10 = 20 Days
 What is Critical Path?
Critical Path is the longest sequence of activity on a project that carry zero free float / slack.
Float Calculation
The whole idea of network diagram and finding the project duration is to identify the critical path and total float. Float represents how much each individual activity can be delayed without delaying successor activities or project completion date.
Total Float = LS – ES or LF – EF
Total Float shows the difference between the Earliest Start (ES) and Latest Start (LS) of an activity before the completion date is delayed.
Free Float = Lowest ES of successors – EF
Free Float represents the amount of time that an activity can be delayed before any successor’s activity will be delayed. A zero free float represents the activity is in critical path and there is no space to delay the activity without delaying the entire project.
Conclusion
Understanding forward pass and backward pass is crucial for a project manager. Although in a project management software, they are calculated automatically. But a project manager should understand how the system has calculated the values.
If you want to learn more on project management, please visit us at https://tiemchart.com/
Tiemchart powered by Insiet ©
Are you project manager or business owner looking for a dashboard and reporting tool? Tiemchart is building customised reports and dashboard using the power of a BI Tools called Insiet © https://insiet.com/ .
Merger and Acquisition solution from Insiet © https://insiet.com/merger-acquisition-ma-system-integration/
Intercompany Reconciliation Solution from Insiet © https://insiet.com/solution/intercompany-reconciliation/

