Project Portfolio Managment
Project reporting is one of the key element of your project controlling process and project governance and its purpose is to ensure that your objectives are being met by monitoring and measuring your project progress regularly to determine variances from your plan.
A good project reporting tool will provide you an opportunity to raise issues or variances form your plan and to take corrective actions before some issues get beyond recovery and help you to create an accountability for your works execution.
With Tiemchart, get a clear view of your project portfolio with big picture to your project data & insights to track and monitor project progress.
Tiemchart PMS is the best project management software tools that allow you to drill down from portfolio to detailed line item view.
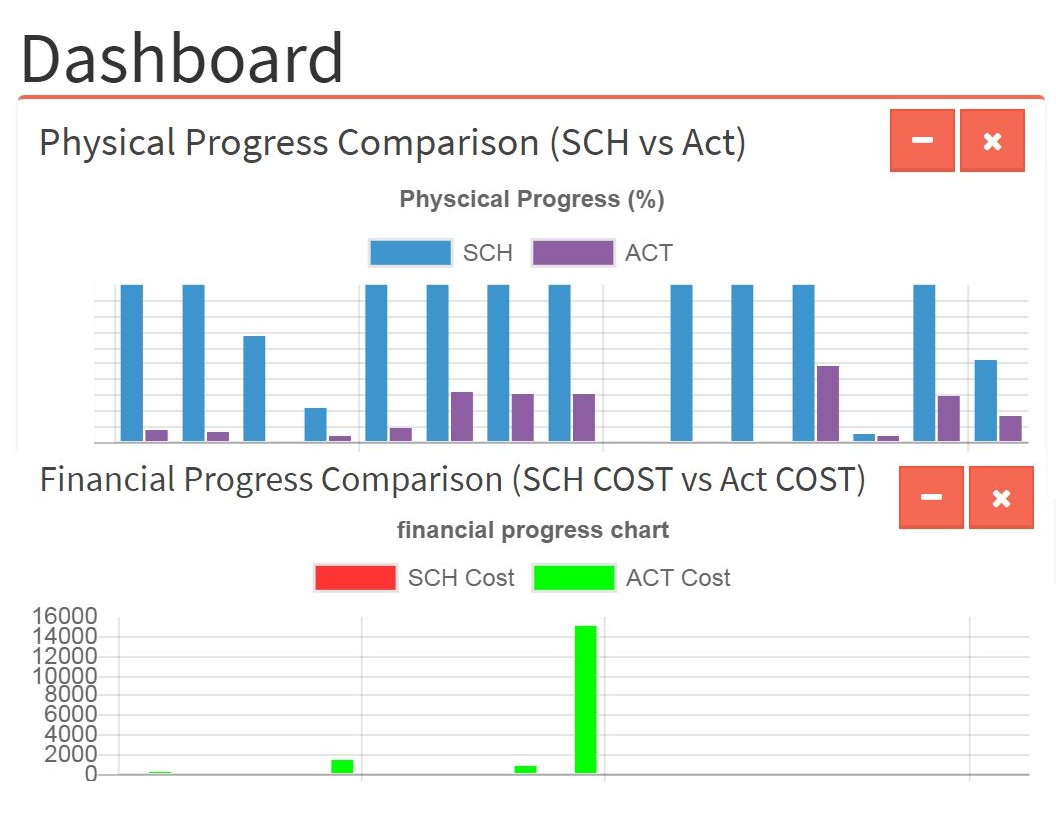
Intuitive Project Reporting Dashboard
A project dashboard is an information display that depicts key indicators of project performance in a format that resembles an instrument panel on a dashboard. This format can convey your overall project’s progress and highlight your particular problems as well, that require further attention.
With Tiemchart online reporting tool you can get a clear picture of everything related to your projects. From active projects to open tasks, overdue tasks and milestones across different projects, you get to see everything at one place.
Elegant dashboard clearly illustrates your project progress, project deadlines, work in progress, physical progress and financial progress keeping your team members and clients informed and up to date.
Manage Task And Team On Gantt Chart

INTUITIVE PLANNING
Tiemchart is easy to use online solution for project planning and scheduling. It will let you create task at multiple level and set dependencies.
TASK RELATIONSHIP
Set Predecessor or Successor of each task & its Lag. TIEMCHART online Gantt chart software carry most advanced features to manage task & team
CRITICAL PATH & NETWORK
Easily identify Critical path directly from the Gantt chart. It has also got inbuilt network diagram to visualize workflow
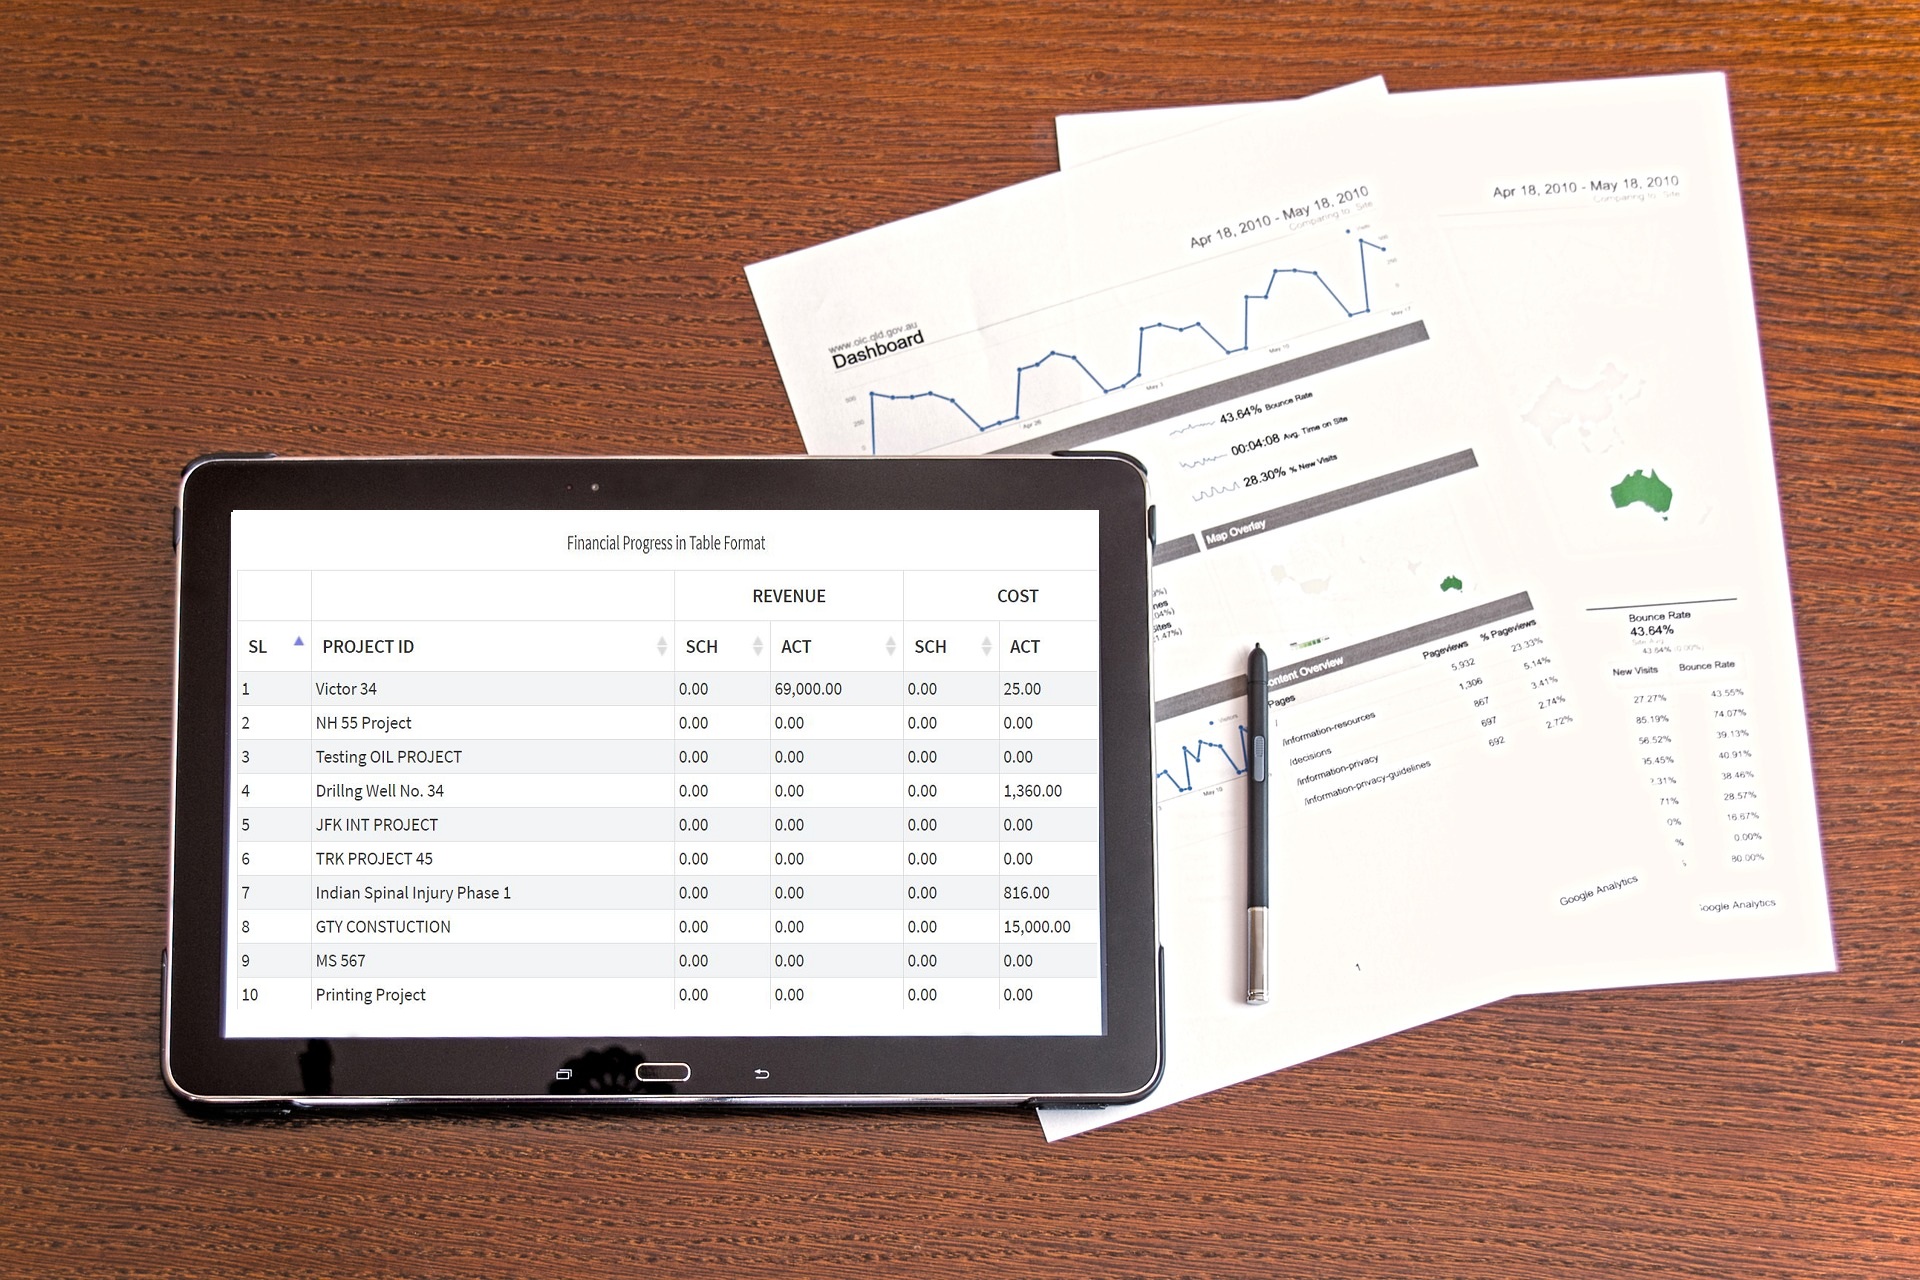
Get Realistic View of Your Financial Reports
Every project manager and all the stakeholders know how financial management is an important and sometimes critical, element in project management reports and successfully executing the project financial reports is dependent upon having an accurate financial information. But in today’s generation just having spreadsheets filled with numbers is not enough for your project’s financial information to really add value.
Tiemchart makes your project financial reports, timely, accurate, relevant financial information, and also provides you a true picture of your project performance and fact-based information to forecast your project financial information in a more realistic way.

Track Actual Billable And Non-Billable Reports
Projects that are billed by the hour, accurate time tracking becomes an essential feature in managing your billable and non-billable reports and often due to some reasons that prevent you from billing your total time spent on a project. As some of your tasks may take longer than expected or it may be your team member’s first time performing the task.
In Tiemchart, project members can post their actual time spent using the automatic self-timer Timesheet features and get your accurate time spent on each task.
You get a report that displays actual time spent per tasks and billable and non-billable hours for your project team members.
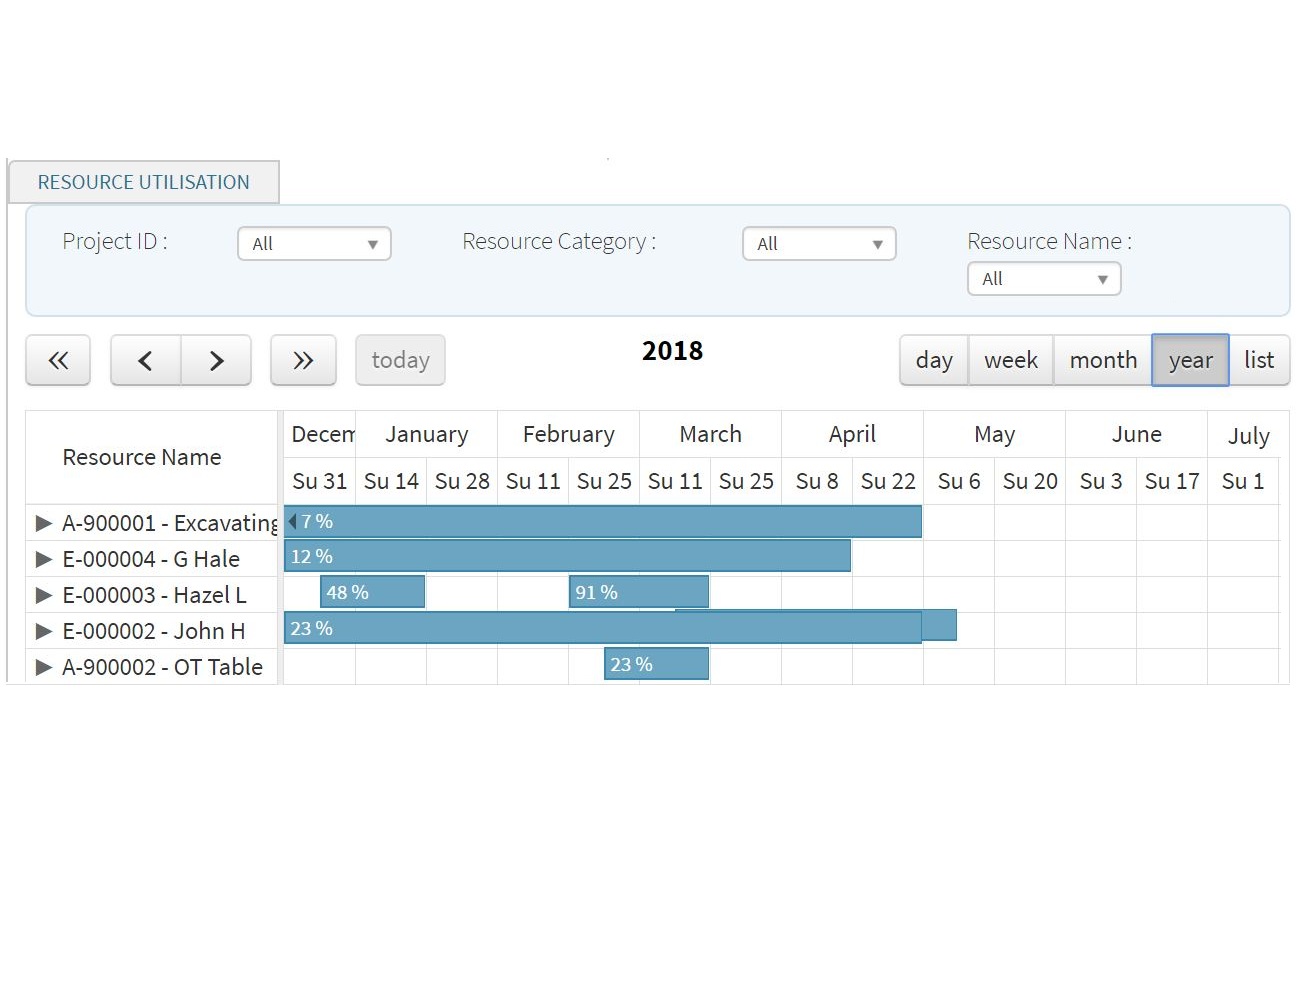
Track Resource Utilization Reports
Going through your entire project plan and working out your allocated resources by hand would take a lot of your time, and would be mind-numbingly dull as well.
Tiemchart will give a reported that is the breakdown of which project team member is allocated to which task and on which day. You can also pin-point over your allocation problems whether your team member is allocated to more than one task.
We develop your project reporting and dashboard features that help managers simplify all their fundamental tasks. You can also grant direct access to your team to head start on monitoring your projects which saves a lot of your time.
Customer Testimonials
Tiemchart has brought a clarity to our project performance and helped us to be more profitable

Dr. N.D. Singh GM – IT, NEDFi
Great overview and granular detail. Much better Gantt charts than other similar programs

J Jennings – First Press – USA
Excellent software with very good training video and good customer support

Larry K – Larkins Construction – Ghana
Award winning Project Management software


Schedule your Free Demo
Request a demo and talk to us via Webex. Scheule a demo as per your available time slot and one of our consultant will be happy to walk through the system with you and clear all doubts. After the demo, you will be given 14 days Free trial access
Request Demo