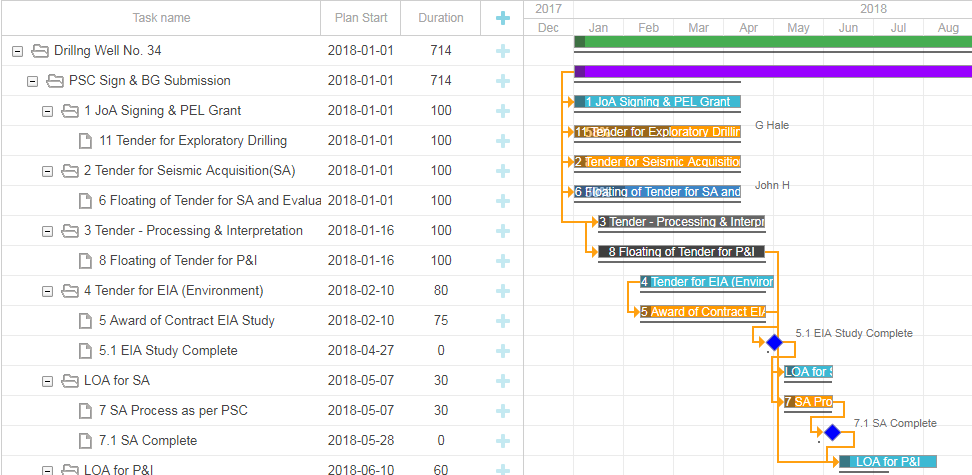
What is Gantt Chart?
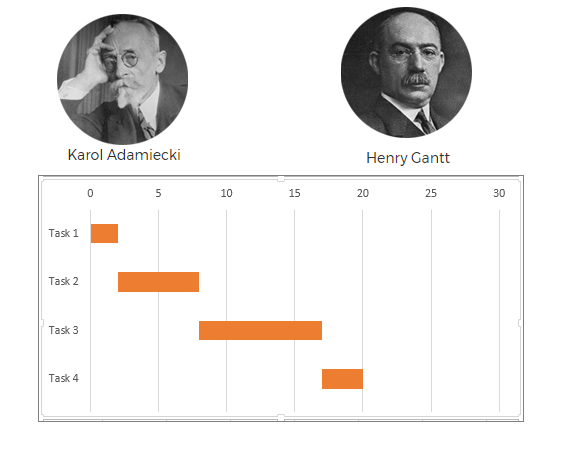
Gant chart provides a graphical representation of your activities by horizontal bars. It is a visual representation of a project schedule which displays the tasks, their dependencies and the timeline. It is powerful tool to represent complex project in a visual format where each activity is represented by a bar. The position of the bar and its length represents the start date, end date and duration of that activity.
In mid 1890s, the first Gantt chart was developed by Karol Adamiecki, a Polish engineer who ran a steelworks in southern Poland. He was interested in management ideas and techniques. Later Henry Gantt, an American engineer and project management consultant devised his own version of Gantt chart and that has gained popularity in western countries.
How to create Gantt chart using Tiemchart?
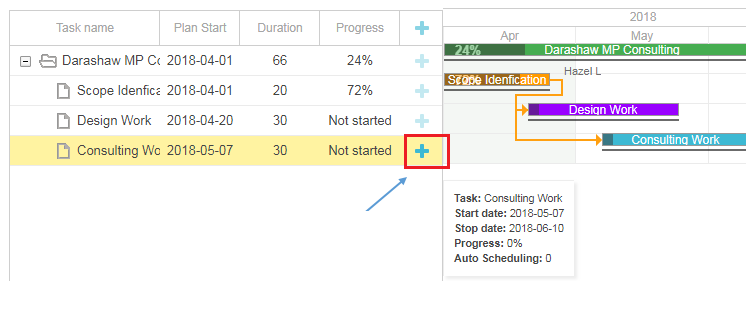
To begin creating Gantt chart using Tiemchart, select the given project and create task or activities inside the Gantt chart tools. There is a create new task option. You will have to decide under which task you would like to create a sub task. With Tiemchart Gantt chart software, you will be able to create task at various levels and hierarchy. Thus giving you the flexibility to set dependent task and milestone.
Set task dependencies by simply drag and drop from one horizontal bar to the other. Once the dependencies are set, you can reschedule your tasks and milestones within the chart itself.
Why Tiemchart is the best Gantt Chart software?

INTUITIVE PLANNING
Tiemchart is easy to use online solution for project planning and scheduling. It will let you create task at multiple level and set dependencies.
Drag & drop schedule
Simple drag and drop task to adjust schedule and timeline. Manage team and track progress
Assign Resources
Tiemchart let you assign resources within the Gantt chart and track progress based on its utilisation
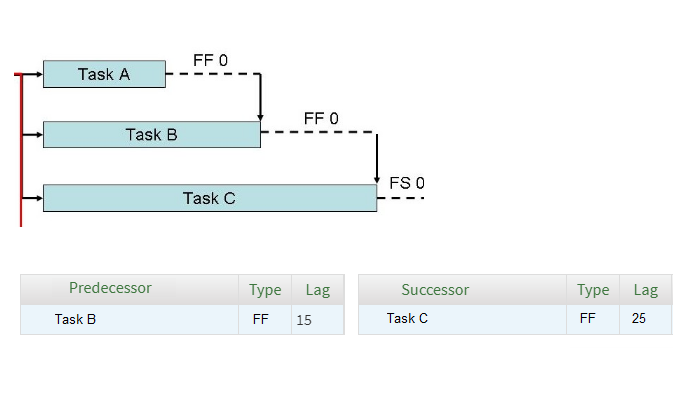
Set Predecessor, Successor and Lag
Deliver complex projects easily in its structure. Once the task are created, you can set dependencies between task by drag and drop between task bars. You can set all sort of relationship between task as per project management methodologies like Start to Start (SS), Start to Finish (SF), Finish to Start (FS) and Finish to Finish (FF). You can also define the lag between the task to display the time duration gap between the preceding activities and succeeding activities.
Import from Excel, MS Project or Primavera
Tiemchart gives you the ability to import project schedule from either Excel, Microsoft Project or Oracle Primavera. Such import brings the task, its dependencies, predecessor successor relationship, Lag and its critical path.
Thus giving you the flexibility to work on your favorite tools and use Tiemchart for enhansed project reporting not supported by these tools.
Assign Resources and track progress
One of the best features of Tiemchart online Gantt chart software is the ability to add material, human, assets or services into the task and track its progress online. All that you can do either within the Gantt chart or in task To-Do List.
To give the project a profitable solution, the process and activities must be well defined and designed in a way that minimizes both initial capital costs and ongoing operating expenses. And this you will be able to do when you are not just tracking progress in terms of percentage completion but also the exact utilization of resources.
Easily build from simple to complex project
Every detail of your project tasks, including percentage complete, duration, start and end dates and owner are displayed based on your project structure or your task dates in a graphical way.
Our modernized designed dashboard enables you to get better insight into understanding who on your team is busy and who’s not. With this information now available in real time, you will be able to assign and reassign resources to project based on their availability right from your dashboard.
Customer Testimonials
Tiemchart has brought a clarity to our project performance and helped us to be more profitable

Dr. N.D. Singh GM – IT, NEDFi
Great overview and granular detail. Much better Gantt charts than other similar programs

J Jennings – First Press – USA
Excellent software with very good training video and good customer support

Larry K – Larkins Construction – Ghana
Award winning Project Management software


Schedule your Free Demo
Request a demo and talk to us via Webex. Scheule a demo as per your available time slot and one of our consultant will be happy to walk through the system with you and clear all doubts. After the demo, you will be given 14 days Free trial access
Request Demo